
What actually fell in the European data?
Mobile Search impressions fell 74% and desktop Search impressions 71% in GMBapi's sample. The comparison uses daily averages per location for 26 September–4 October against 15–21 September 2026. It covers approximately 15,000 locations in 24 EEA countries, not every business in Europe.
- Mobile Search impressions: −74%.
- Desktop Search impressions: −71%.
- Maps impressions: −1%.
- Calls, website clicks and direction requests combined: −2%.
The break happened over four days
The Search index moved from 100 in the baseline week to about 27 from 26 September. The decline unfolded between 22 and 26 September rather than following a gradual seasonal pattern. Around 10,400 tracked locations in the US, UK and Switzerland showed no comparable break.
Actions are not the same as acquired customers
Stable calls, clicks and direction requests are encouraging, but they do not prove stable sales. A phone click is not an answered call, and one person can perform several actions. Check CRM enquiries, bookings and completed sales for each location before making a commercial claim.
How DMA changed the search-result context
The Digital Markets Act prohibits designated gatekeepers from favouring their own services in ranking. On 23 July 2026, the European Commission announced €890 million in Google fines, including €460 million concerning Search self-preferencing. Google's EEA result formats now include aggregator and direct-supplier units, but that alone does not establish how profile impressions are counted.
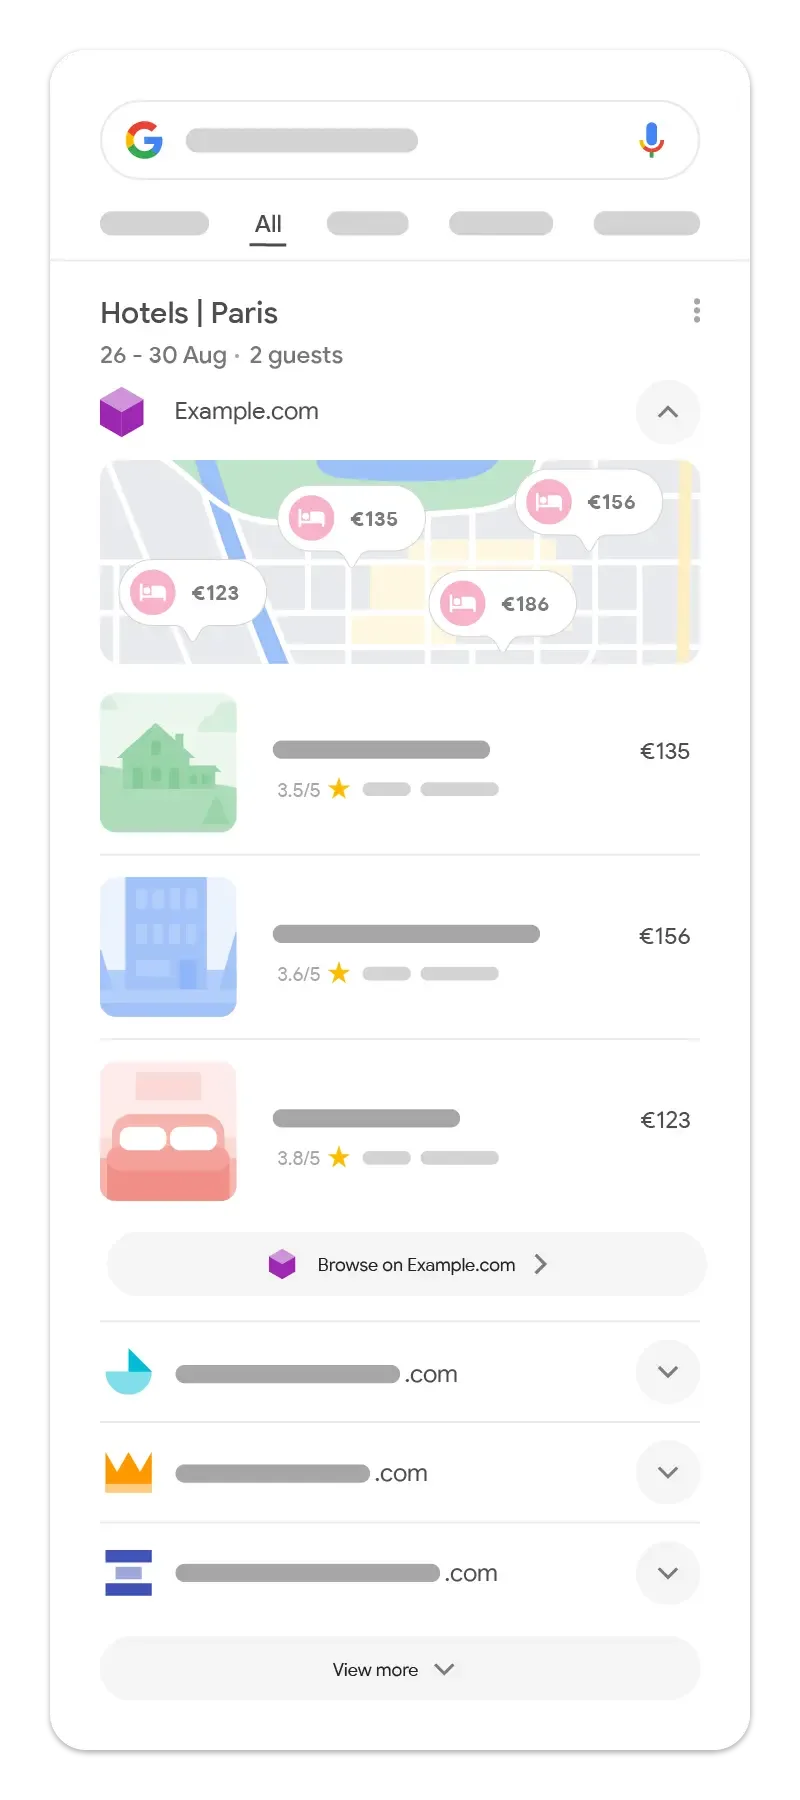
Aggregator units put comparison services into the result
An aggregator unit displays results supplied by eligible comparison, travel or directory services. The top-ranked provider is expanded by default, and users can switch to another available provider. The format covers relevant searches for hotels, transport, products, local businesses and things to do in the EEA.
Supplier units show direct providers alongside aggregators
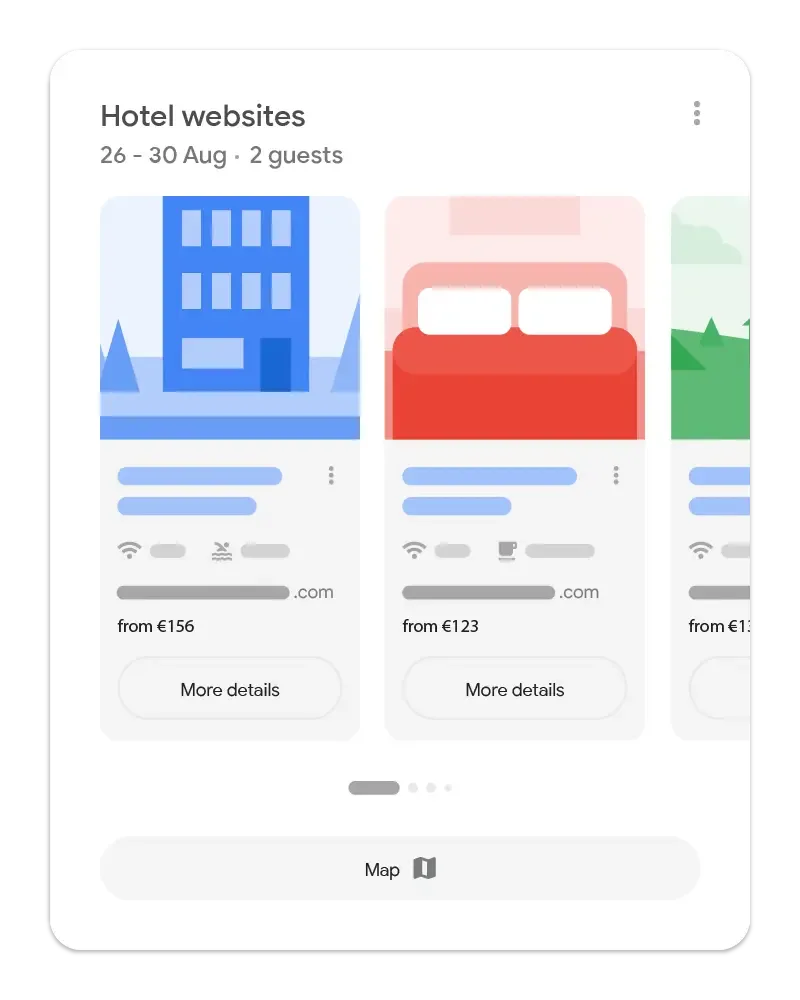
The supplier unit is intended for direct providers such as individual hotels and local service businesses. Google states that it appears only when an aggregator unit appears. This makes a company's own website relevant alongside its profile and third-party listings, without guaranteeing inclusion for any particular query.
Why a counting change remains a hypothesis
The fall also affected categories where GMBapi's spot checks found no aggregator unit. Insurance agencies lost 64% of Search impressions, day care centres 70% and auto repair shops 74%. A layout change confined to selected queries cannot by itself explain every observed category, but the study does not establish Google's internal measurement mechanism.
That’s our hypothesis, not a confirmed fact.
Hotels saw a separate earlier change
The hotel sample first fell by about 70% after the 8 September rollout, then declined again with other categories. That first percentage is not the combined effect of both stages. The hotel sample contained only 56 locations, so treat the sequence as evidence to investigate rather than a universal industry estimate.
A higher action rate is not proof of better optimisation
GMBapi reports actions per 1,000 total Search and Maps impressions rising from 73 to 100. A smaller denominator can increase this rate without additional customer activity. Keep the denominator explicit: those figures do not describe actions divided by Search impressions alone.
How European multi-location teams should report now
Report customer actions and business outcomes alongside impressions, with the September break clearly annotated. Split Search from Maps and separate countries rather than hiding differences inside a European total. Use a marketing audit to reconcile acquisition reports with actual enquiries before reallocating budget.
Use comparable periods and a non-EEA control group
Compare daily averages or periods of equal length instead of raw totals from seven and nine days. If your network includes UK or Swiss locations, use them as controls while accounting for different holidays and demand patterns. The EEA includes the EU plus Iceland, Liechtenstein and Norway; it is not interchangeable with all of Europe.
- Annotate 22–26 September; hotels should also mark 8 September.
- Separate Search impressions, Maps impressions and each action type.
- Track enquiries and bookings alongside platform metrics.
- Check local rankings and profile status where actions also fall.
Keep multilingual listings consistent
Maintain one verified operational source for addresses, telephone numbers, opening hours and service availability. Synchronise each local-language website, Google profile and relevant booking platform from that source. Translate descriptions for the market, but do not let translations change factual contact or opening-hour data.
What should change in local SEO work?
Keep profiles complete and accurate rather than rewriting them in response to one chart. The new result formats make third-party listing accuracy more visible to potential customers. Work on local SEO and AI search visibility should still be judged by relevant discovery and qualified enquiries.
Check intermediary listings before changing the profile
GMBapi observed a restaurant whose aggregator listing showed different opening hours from its Google profile. The first expanded provider can therefore affect what a visitor believes about the business. Audit the platforms actually used in each market; provider order is not fixed.
Investigate genuine losses independently
A reporting hypothesis should not become an excuse for every decline. If calls, bookings and rankings also fall, inspect profile restrictions, changed details, competition and seasonal demand. Review the evidence for the individual branch before changing its category, name or marketing budget.
Summary
The observed EEA impression drop is large, but the measured action decline is much smaller. That supports a reporting-change hypothesis without proving it for every business. Keep local SEO work grounded in enquiries, accurate listings and comparable data.
Your next reporting decision
Explain the break before presenting a year-on-year impression comparison. Keep action metrics and revenue evidence beside the visibility chart. If you need help reconciling the numbers, contact our team.
Sources and limits
The primary data comes from GMBapi's analysis, published 13 October and updated 21 October 2026. Result-format descriptions follow Google's aggregator documentation and supplier documentation. The legal context is documented in the European Commission announcement; neither that announcement nor the interface documentation confirms the proposed counting mechanism.